Bands of Bands
Regré Shun runs a gym and collected data about members of an exercise program.
They’ve heard that the number of hours you exercise is linearly related to the
risk of heart disease in the future, so they decide to do a quick linear
regression problem (i.e., order = 1). Their output $\theta$ and $\theta_0$,
however, seem to imply that the more hours one exercises, the higher the risk of
heart disease. This is confusing since Regré always thought exercise was good
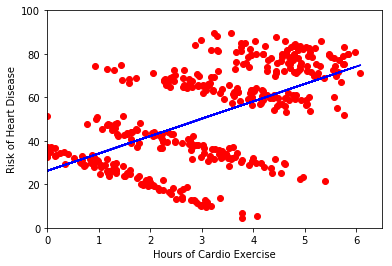
for you! So, they call you up for help and you ask to look at the data. Here’s
what you see:
4A) What do you observe about this data? Did Regré calculate their
model correctly? Does exercise increase your risk of disease?
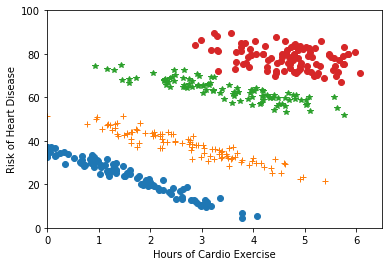
4B) When you look carefully, you can see that there appear to be
“bands” in the data (see figure below). It turns out these bands correspond to
age groups. How might that affect heart disease risk?
4C) Knowing this, how could you change your model? Would using multiple
models help? If you wanted to use a single model, what could you do? (It's okay
if you don't have perfect answers to these questions! The checkoff is meant as
an avenue to discuss!)
4D) In this case, Regré Shun had the idea to look more carefully at the
data since it didn't agree with their intuition. What might have happened if
they had run a regression analysis on some data, and the results did agree with
their intuition, but their intuition was wrong? What if they had no intuition
about their data or a way to visualize it? Does your answer have any
implications for using machine learning tools in practice? Are there situations
where we care more about these questions than in others?
Food for Thought
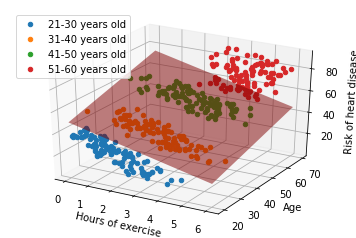
The phenomenon illustrated above is called “Simpson’s Paradox”. It is a
statistical phenomenon where a trend appears in several different subgroups in
data, but disappears -- and sometimes reverses -- when the subgroups are
combined. Here's what the data looks like when viewed in three-dimensions --
note we can still fit a linear model to this (a plane)!
Here are some places where you can read more about Simpson's Paradox:
Discussion Guide
- A) subparts seem to have negative slope, whereas overall trend claims positive slope. The data overall have that trend, but there appear to be subparts.
- B) Older people have higher risk for heart disease
- C) Could use several models, one per risk group; could include age/risk group in addition to amount of exercise as a feature in a single model
- D) [meant for discussion] could cause serious consequences in contexts where these models are used to give advice about lifestyle changes; it’s important to consider logic and other physical models and make sure we are not contradicting those.